
Take a look at our leading performances

Why our growth portfolios are leading the pack
Over the past year, our Growth Portfolios have delivered some of the strongest results in the entire UK MPS market with our Growth Speculative portfolio having the best performance in its equity category over the past year (1 out of 90). Most of the other Crossing Point Growth portfolios are also around the top 1% in their respective equity categories of 200-400 portfolios with Adventurous in the top 1.6% (4 out of 248), Strategic 1.3% (5 out of 359), Balanced 1% (4 out of 374), Cautious 4.8% (within the higher equity Balanced category and still 18/374), and Defensive 0.7% (2 out of 283).[1]
Consistent outperformance across every Growth mandate
Although the above table only shows our 1-year results, a further Morningstar breakdown shows that most of the Growth portfolios were in the top quartile over 2 years, and since inception over 2.5 years.
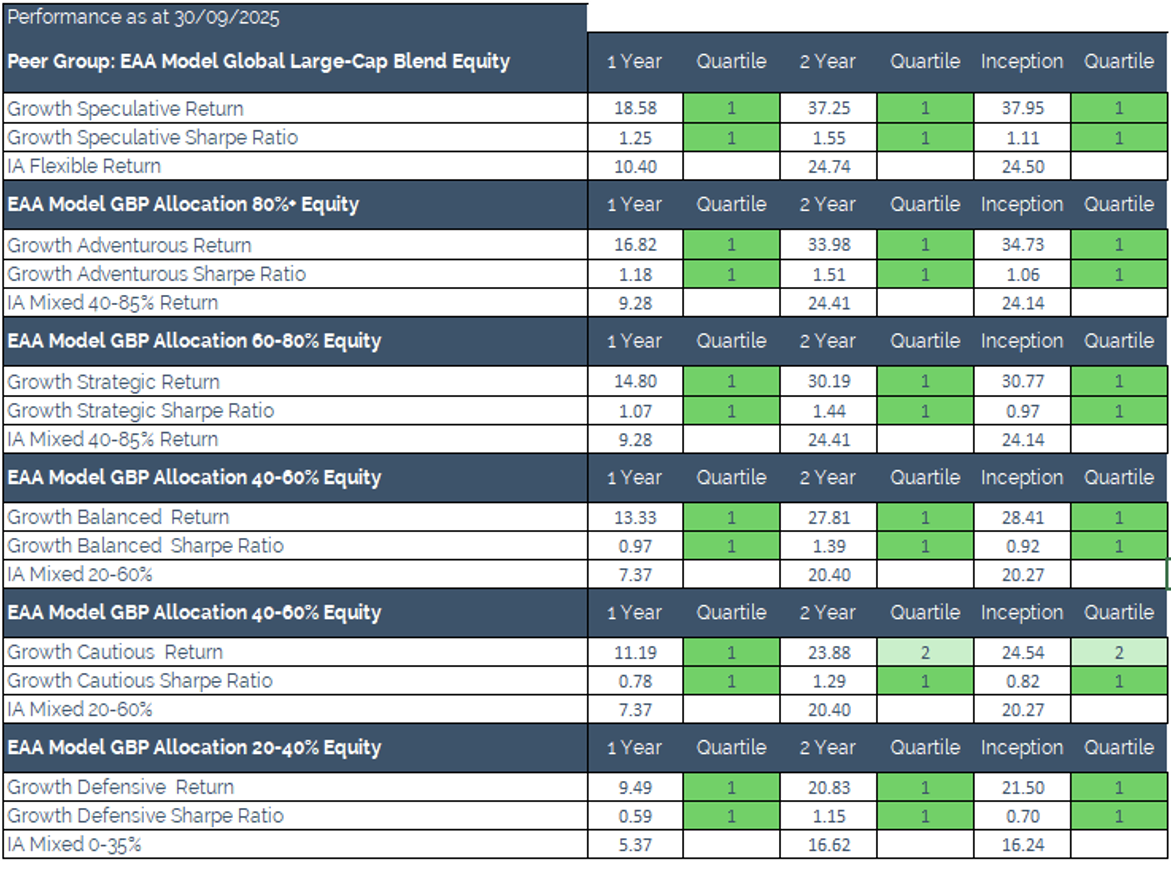
And it's not just about raw returns. Our Sharpe Ratios - which measure risk-adjusted returns - also rank in the top quartile across all Growth portfolios. This means that although we are delivering excess performance it is without taking excessive risk.
The pattern is consistent across the Crossing Point Growth range – Speculative, Adventurous, Strategic, Balanced, Cautious, and Defensive:
· Top quartiles on both return and Sharpe Ratio
Strong performance across 1 year, year-to-date, 6-months, 2 years, and since inception over 2.5 years
Most Growth portfolios top 2% of Morningstar peer groups over 1 year
Outperforming many of the biggest names in the MPS space
Our performance is driven by process.
It's down to how we're structured, how we select funds, and how we respond to market signals in real time.
Strategic diversified asset allocation built from evidence, not opinion
Rigorous fund selection with a strict framework
Blended portfolio of selective active and cost-efficient passive funds
Consumer Duty indicators ensuring suitability, robustness and value for money
Daily monitoring of all portfolios
Trend analysis that guides when we add or trim risk
It’s true however, that anyone can have a strong quarter. What matters for advisers - and crucially, for clients - is consistency over time.
That's why we're particularly pleased to see our portfolios performing well not just over 1 year, but across 2-year and since-inception periods as well. It suggests our processes are working across different market conditions, not just in one specific environment.
And while we're obviously pleased with current performance, we're not complacent. Markets change. Conditions shift. What worked brilliantly in one period may need adjustment in the next.
That's precisely why we focus on process as well as outcomes. Strong performance should be a result of disciplined investing - not a goal pursued at the expense of risk management.
Performance in context: what this means for you
For financial advisers and planners, strong portfolio performance translates into more than just good client reviews. It means:
Easier client conversations - When portfolios are performing well, clients are more confident and less anxious
Stronger suitability evidence - Consistent performance supports your central investment proposition and demonstrates good outcomes under Consumer Duty
Business resilience - When your investment solution can demonstrate responsive risk management and strong returns, you're better positioned for whatever markets throw at us next
We know the MPS landscape is competitive. What we'd say is this: great performance should come with great management.
Because when the next market shock arrives - and it will - you'll want to know your investment solution isn't just riding favourable conditions, but is built to navigate whatever comes next.
If you'd like to understand more about how our portfolios are structured, or how our approach might fit within your central investment proposition, please email Carl Hagger, our Business Development Manager.
[1] Calculation Basis GBP, Net of DFM & Underlying Asset Management Fees. Retrieved from Morningstar 25.11.2025 for data to the end of September 2025.