
Connect through our academic library and discover a wide range of free-to-access academic and education resources.
Trend-following Education Resource Library
Discover a wide range of free-to-access academic and education resources that demonstrate the benefits of trend following.
Risk management using trend-following
The first step in managing the risk of investing is to diversify i.e., spread investments across assets whose returns are not highly correlated). This implies holding a portfolio of different types of assets or assets of the same type with different exposures so that if one asset falls in value it does not mean that other assets will fall in value at the same time. However, even well-diversified portfolios holding hundreds of securities can suffer large drawdowns, or reductions in value, in a crisis (e.g., the 2008 Financial Crisis). For investors concerned about large losses, trend-following strategies have been shown, in the academic literature, to reduce the risk of large losses without significantly reducing long run returns.
Trend-following is generally the application of simple moving average rules. In simple terms, a moving average removes noise from the trend. These rules provide a signal that a market has turned down (or up) and therefore the investor should be selling (buying) the asset in that market. If an investor is selling the asset based on the trend following signal they should move into cash until the trend following signal indicates to repurchase the asset. Trend-following in many academic articles is also referred to as time series momentum.
-
M Faber ‘A quantitative approach to tactical asset allocation’
Journal of Wealth Management, Spring 2007 (updated 2014)
This was one of the first papers to demonstrate that applying a simple moving average strategy to each asset in an internationally diversified portfolio of assets, an investor is able to increase risk adjusted returns in a diversified portfolio. In addition, the investor would have also been able to avoid many of the protracted bear markets in various asset classes. Avoiding these massive losses would have resulted in equity-like returns with bond-like volatility and drawdown.
-
T J.Moskowitz, Y H Ooi,, L H Pedersen ‘Time series momentum’
Journal of Financial Economics (2012)
This article documents significant ‘‘time series momentum’’ in equity index, currency, commodity, and bond futures for each of the 58 assets they consider. It shows that a diversified portfolio of time series momentum strategies across all asset classes delivers substantial abnormal returns and performs best during extreme markets.
-

T Roncalli ‘Keep up the momentum’
Thierry Roncalli, Quantitative Research, Amundi Asset Management, Paris
This article provides a more mathematical demonstration of how trend following provides risk reduction in a diversified portfolio in bad times.
-

A Clare, J Seaton, P Smith, S Thomas ‘Breaking into the Black box: Trend following, stop losses and the frequency of trading - The case of the S&P500’
Journal of Asset Management (2012)
They find that over a historical period of 60 years, a range of fairly simple rules, including the popular 200-day moving average trend-following rule, dominate just passively holding an investment in the S&P index.
-

Wesley Gray, Alpha Architect ‘Avoiding the Big Drawdown with Trend-Following Investment Strategies’
Wesley Gray, PhD
Wes Gray at Alpha Architect is an advocate of trend following strategies and in this paper he presents a lot of evidence for different assets that using trend following as an investment strategy provides the possibility of lowering maximum drawdown risk, while also offering a chance to participate in a majority of the upside associated with a given asset class.
"We analyse the movement of stock market prices over differing time periods in order to decide if a market has rising momentum and should be bought or falling momentum and should be sold."

Prof Mike Buckle
Investment Manager
Trend-following Back Testing
Crossing Point’s trend-following strategy for portfolio management has been rigorously back tested and our investment process follows a strict rules-based system.
As an example of how the Crossing Point trend-following strategy works, we show the returns of the strategy through the use of equity market indexes and the current Adventurous equity asset allocation. The 23-year time period, from August 1996 to August 2019, exposes the strategy to a number of different market conditions.
Because not all of the unit trusts, ETFs, or the basket of alternative safe haven assets existed over the entire 23 years, this time frame does not allow for a complete replication of our strategy. Instead, we have reflected how the equity investments would have performed through the use of indexes trading directly into either cash or the UK All Stock Gilt Index to represent the safe haven basket.
The complete, backtested, simulated portfolio results using our selected unit trusts and the basket of safe haven alternative investments when not in equities is available for 5 years in our factsheets. We will continue to publish the performance of our live portfolios against the Investment Association benchmarks including risk measures such as volatility, alpha, beta, maximum drawdown, Sortino ratio and Sharpe ratios.
Guardian Portfolios as a Decumulation Strategy
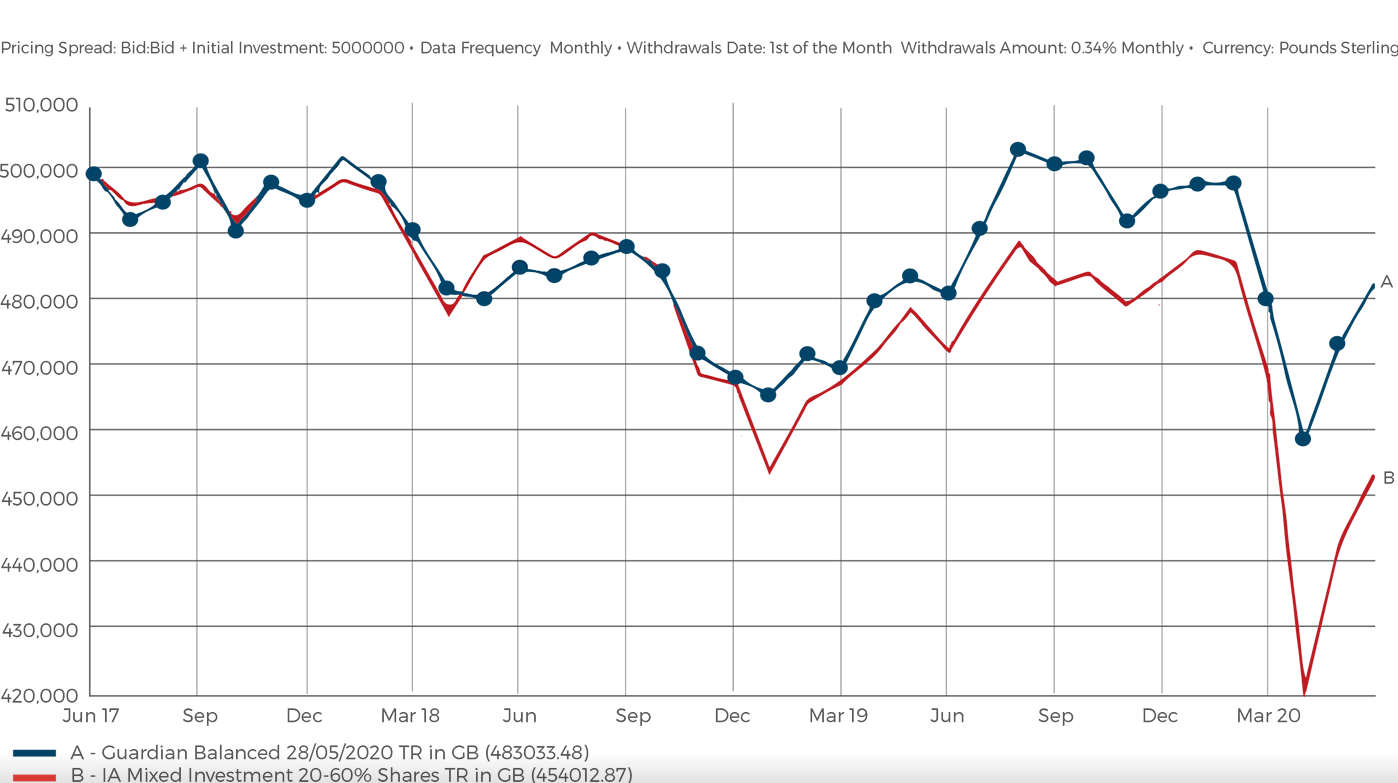
Example 1: A £500,000 investment over 3 years with a 4% annual income paid monthly Guardian Balanced Portfolio vs. IA Mixed Investment Benchmark 20-60% (Crossing Point portfolio data is simulated until trading went live on Feb 1, 2020.)
This graph displays the simulated performance of a £500,000 investment into the Guardian Balanced portfolio over 3 years from May 2017 taking an annual income of 4% compared with the same investment and income for a portfolio based on the Investment Association 20-60% benchmark. From Feb 1st 2020 when Guardian portfolios went live, the data is no longer simulated. This graph provides an illustration of the advantages of the Guardian portfolios which smooth returns by reducing volatility, maximum drawdown losses and sequence of returns risk when compared with the benchmark especially when there are dips in the market such as in late 2018 and beginning of 2020 due to the coronavirus crisis. By using Guardian portfolios, an investor would have ended the 3-year period with £29,020.61 (6.4%) more than an investment in the benchmark. This graph illustrates the benefits of reduced volatility upon income paying portfolios.
Examples of income withdrawals for 5 years from a Guardian portfolio
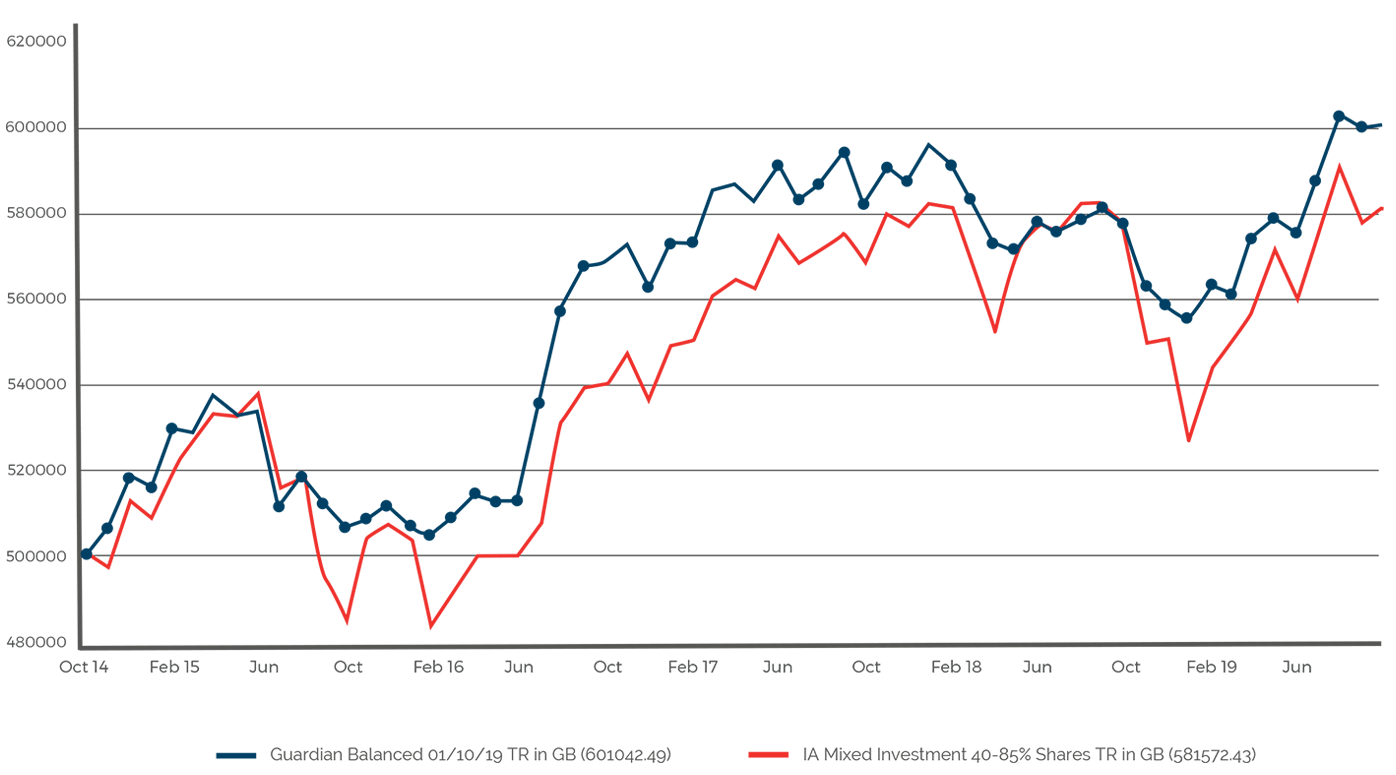
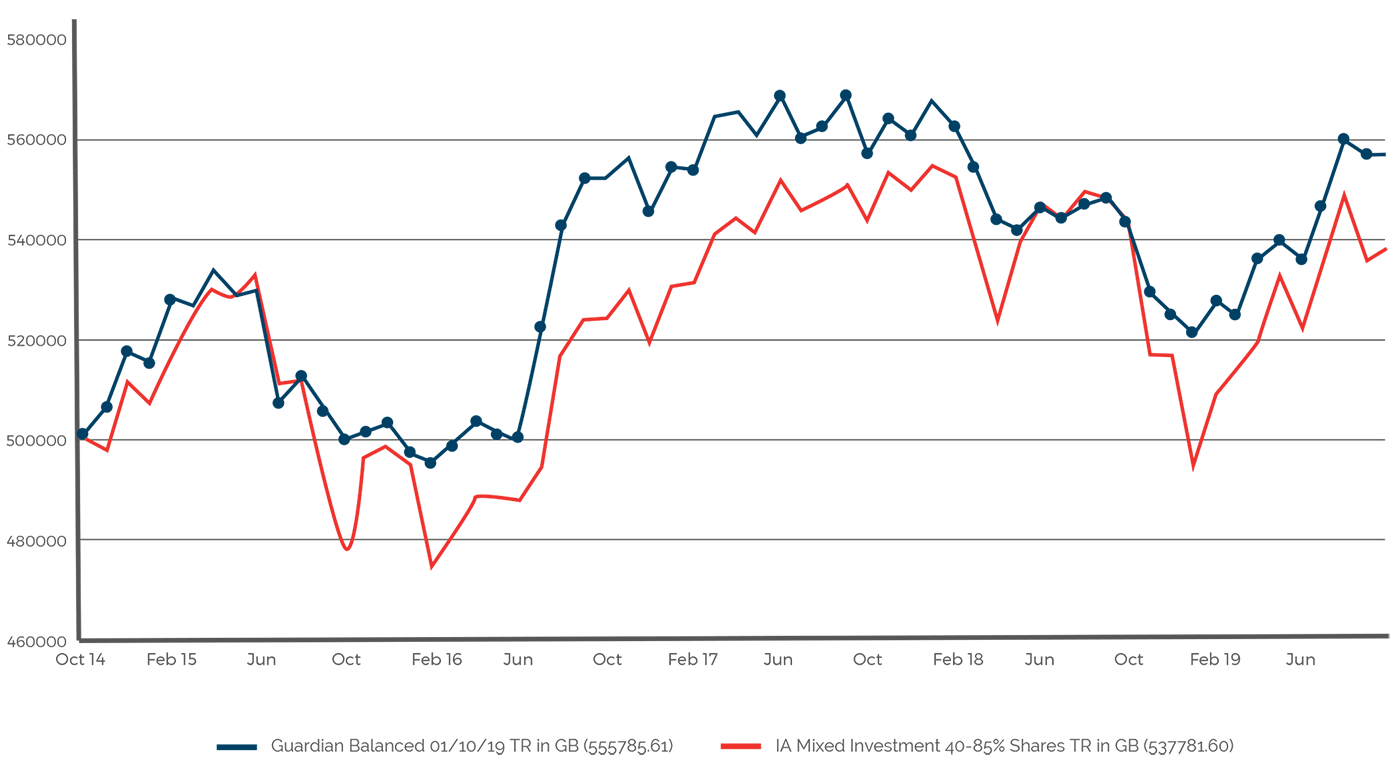
Example 2: Guardian Balanced Portfolio Simulation of a £500,000 Investment Taking a 3.5% Annual Income vs the IA Mixed Investment 40-85% Benchmark
This graph displays the simulated performance of a £500,000 investment into the Guardian Balanced portfolio over 5 years from October 2014 taking an annual income of 3.5% compared to the same income from the Investment Association 40-85% benchmark. This graph provides an illustration of the advantages of the Guardian portfolios which smooth returns by reducing volatility, maximum drawdown losses and sequence of returns risk when compared to the benchmark especially when there are dips in the market such as in 2015 and late 2018. By using Guardian portfolios an investor would have ended the 5 year period with a significantly higher value in the investment. This graph illustrates the benefits of reduced volatility upon income paying portfolios.
Example 3: Guardian Balanced Portfolio Simulation of a £500,000 Investment Taking a 5% Annual Income vs the IA Mixed Investment 40-85% Benchmark
This graph displays the simulated performance of a £500,000 investment into the Guardian Balanced portfolio over 5 years from October 2014 taking an annual income of 5% compared to the same income from the Investment Association 40-85% benchmark. This graph provides an illustration of the advantages of the Guardian portfolios which smooth returns by reducing volatility, maximum drawdown losses and sequence of returns risk when compared to the benchmark especially when there are dips in the market such as in 2015 and late 2018. By using Guardian portfolios an investor would have ended the 5 year period with a significantly higher value in the investment. This graph illustrates the benefits of reduced volatility upon income paying portfolios.
Examples of how our Guardian strategy works and the impact on the sequence of returns risk
-
Guardian Trend Following During A Crisis
Guardian trend following during a crisis document shows how the strategy worked in back testing during the 2008 crisis and live through the Covid-19 crisis.
-
Guardian Decumulation Strategy
The Guardian decumulation strategy document displays the effectiveness of the Guardian portfolios as a decumulation strategy.
-
Sequence of Returns Risk
This document demonstrates the impact that the sequence of positive and negative rates of return can have on an investment.